In the digital age, data is everywhere, and the ability to effectively analyze and visualize it is a valuable skill. Power BI, a powerful business intelligence tool developed by Microsoft, empowers users to turn raw data into insightful dashboards that drive informed decision-making. This step-by-step guide will walk you through the process of creating your first Power BI dashboard, from setting up data sources and designing layout to adding interactive visualizations and sharing your insights with others. Whether you’re a data enthusiast looking to enhance your skills or a business professional seeking actionable insights, this guide will equip you with the knowledge and tools to harness the full potential of Power BI.
Introduction to Power BI
Overview of Power BI
Power BI is a powerful data visualization and business intelligence tool developed by Microsoft. It allows users to connect to various data sources, transform data, and create interactive dashboards and reports to gain valuable insights.
Benefits of Using Power BI

Using Power BI can be a game-changer for businesses of all sizes. It helps in making data-driven decisions, spotting trends, and sharing insights with stakeholders in a visually appealing and easy-to-understand format. Plus, it saves you from drowning in a sea of Excel sheets.
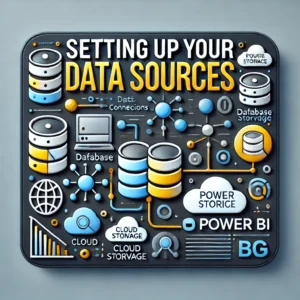
Setting Up Your Data Sources
Before you can work your magic with Power BI, you need to set up your data sources. Think of it as laying down the foundation for your data castle.
Connecting to Data Sources.

Power BI allows you to connect to a wide range of data sources, from Excel spreadsheets to cloud databases like SQL Server and Google Analytics. Simply choose your data source, wave a digital wand, and watch the connection unfold like a digital romance.
Data Preparation and Transformation
Once your data is connected, it’s time to whip it into shape. Power BI provides tools for data preparation and transformation, allowing you to clean, filter, and reshape your data like a data ninja. Get ready to say goodbye to messy data and hello to organized bliss.
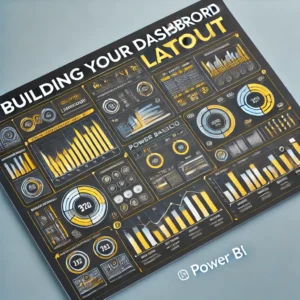
Building Your Dashboard Layout
Now comes the fun part – building your dashboard layout. It’s like arranging furniture in your dream data house, but way more exciting.

Creating a New Dashboard
With Power BI, creating a new dashboard is as easy as pie (data pie, of course). Just click a few buttons, give it a name, and voila – your blank canvas is ready for your data masterpiece.
Adding Tiles and Sections
Think of tiles as your data’s fancy outfits and sections as their stylish compartments. You can add various tiles like charts, graphs, and tables to your dashboard, and organize them into sections for a sleek and structured look. It’s like arranging a buffet for your data-hungry eyes.
Adding Visualizations and Interactivity

Visualizations are like the cherry on top of your data sundae, making it not only delicious but also delightful to look at. And interactivity? Well, that’s like adding a sprinkle of magic to make your data dance.
Choosing the Right Visualizations
Power BI offers a plethora of visualization options, from bar charts to scatter plots to maps. Choose the right visualization that best represents your data and tells your data story in a captivating way. It’s like picking the perfect outfit for your data’s big presentation.
Configuring Interactivity Options
Interactivity is the secret sauce that brings your dashboard to life. With Power BI, you can add filters, slicers, and drill-down capabilities to allow users to interact with your data dynamically. It’s like giving your data a voice and letting it engage in a lively conversation with your audience.
Implementing Filters and Slicers
Filters and slicers are like the dynamic duo of data refinement in Power BI. Filters help you narrow down your data based on specific criteria, while slicers provide a user-friendly interface for interactive filtering.
Using Filters to Refine Data
Filters are your best friend when it comes to refining the data displayed on your dashboard. You can apply filters to individual visuals or the entire report to focus on specific subsets of your data. Want to see sales data only for a particular region or time period? Filters have got your back.
Utilizing Slicers for Dynamic Filtering
Slicers take filtering to the next level by offering an interactive way for users to slice and dice the data. These nifty little tools provide buttons or dropdown menus that allow users to dynamically filter the visuals on the dashboard. It’s like giving your audience the power to play around with the data themselves, without messing up your carefully crafted analysis.
Customizing Design and Formatting
Now that you’ve nailed down the data crunching part, it’s time to make your dashboard visually appealing and easy on the eyes.
Themes and Color Schemes
Power BI offers a range of pre-designed themes and color schemes to help you quickly jazz up your dashboard. Whether you’re going for a professional look or something more vibrant and bold, there’s a theme to suit every taste. Plus, you can customize colors to match your company branding or personal preferences.
Formatting Options for Visuals
Don’t let your visuals be basic. Power BI gives you the tools to make them pop with formatting options like fonts, sizes, borders, and backgrounds. You can align and format your visuals just the way you like to create a polished and professional look.
Sharing and Collaborating on Your Dashboard
You’ve put in the hard work, and now it’s time to show off your masterpiece to the world (or at least your team).
Sharing Options in Power BI
Power BI makes it easy to share your dashboards with colleagues, clients, or anyone else who needs to see your insights. You can share reports via email, embed them in websites, or publish them to the Power BI service for easy access.
Collaboration Features and Permissions
Collaboration is key in today’s world, and Power BI offers robust features to help you work together seamlessly. You can set permissions to control who can view or edit your reports, collaborate in real-time with colleagues, and even leave comments and annotations to communicate ideas effectively. It’s teamwork made easy. As you wrap up your journey in creating your first Power BI dashboard, remember that data visualization is a powerful tool that can transform the way you understand and communicate information. By mastering the techniques outlined in this guide, you are well on your way to unlocking the full potential of your data and making data-driven decisions with confidence. So, go ahead, explore, experiment, and continue to refine your dashboard creation skills in Power BI. The possibilities are endless, and the insights you uncover may just shape the future of your organization.
FAQ
Can I use Power BI for free?
Yes, Power BI offers a free version with limited features that is suitable for individual users and small businesses. There is also a paid version, Power BI Pro, which provides additional capabilities and collaboration options.
Do I need coding skills to create a Power BI dashboard?
No, Power BI is designed for users of all skill levels, including those without coding experience. The intuitive interface and drag-and-drop functionality make it easy to create visually appealing dashboards without writing any code.
Can I connect Power BI to different types of data sources?
Yes, Power BI supports a wide range of data sources, including Excel spreadsheets, SQL databases, cloud services like Azure and Google Analytics, and many more. You can easily connect to your data source of choice and start building your dashboard.


